Overview
RetailPOS is a point-of-sale dashboard that we designed and built to give retail teams a live view of how the counter is performing. It reports daily revenue, the items selling best and the way customers are paying, in a layout meant to be read quickly by someone standing at a till instead of sitting at a desk.
The Challenge
Most sales reporting is made for a manager at a large monitor, with dense tables and filters that assume time to study them. A retail counter is different: the screen is small, the environment is busy, and the person looking wants a quick answer. How is today going, what is moving, and are people paying by card or cash? A dashboard that needs squinting or scrolling fails there, however accurate its numbers.
Who Uses It and How
A shift lead glances at the screen between customers to see whether the day is tracking well. A buyer or owner looks at the top-items list to decide what to reorder before the weekend. The person closing the till uses the payment split to sense-check what should be in the drawer compared with the card terminal.
Store managers with several tills may look at the dashboard on a larger screen at the back office, so the same layout has to scale both down to a terminal and up to a monitor.
Our Approach
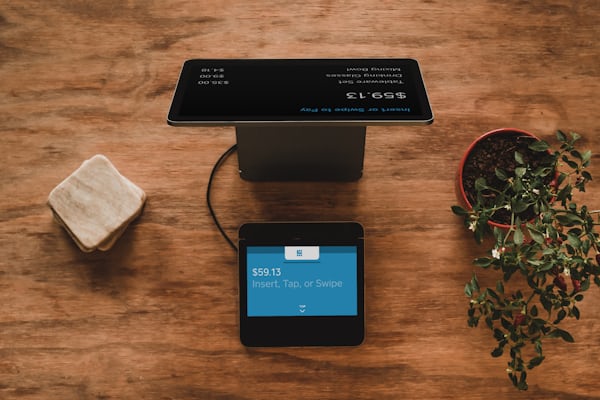
Legibility came first. Each headline figure sits on its own large card with a clear label, so the most important numbers can be read from a distance. We kept the number of elements deliberately small and made the payment breakdown a simple visual rather than a table. POS terminals often have compact displays, so we built and tested at those sizes from the beginning, instead of shrinking a desktop design afterwards.
What We Built
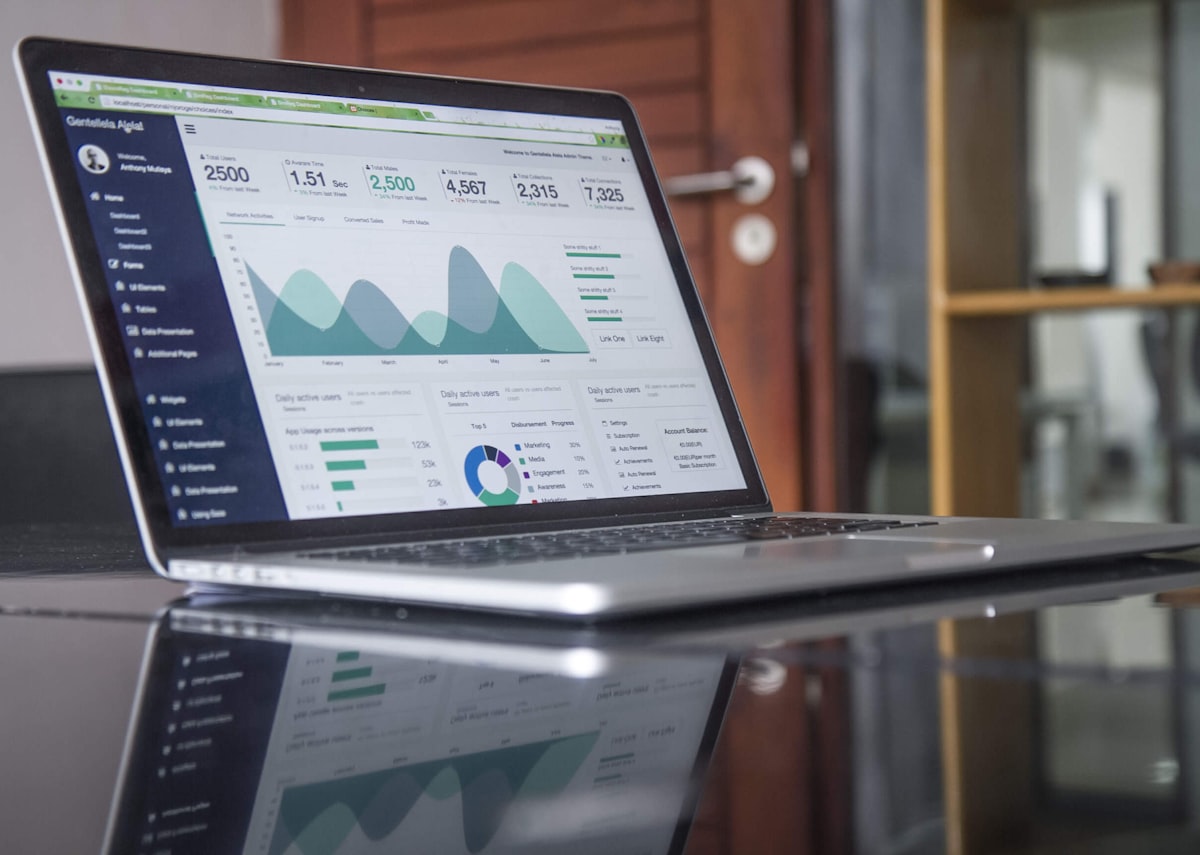
The dashboard opens on a row of high-visibility cards for daily revenue and related totals. Beneath them, a top-items section lists the products leading the day, and a payment-method chart shows how takings divide between the ways customers paid. Colours and type sizes were chosen for contrast under shop lighting, and components resize cleanly between terminal and large screens. Figures refresh so the picture reflects the current trading day.
Architecture and Data
Sales arrive as transaction records with line items, totals and a payment type. A Node.js service aggregates them into the daily summaries the interface shows, so browsers receive small, ready-made figures instead of raw transactions. PostgreSQL does the grouping by day, product and payment method, and indexes on date keep the queries quick. Refunds, voids and discounts need explicit treatment so that revenue is not overstated, and the definition of a trading day, including a close after midnight, is a setting per store.
Security, Privacy and Quality
Revenue and product performance are sensitive to a business, so the dashboard sits behind sign-in and roles. The reporting layer needs only totals and payment type, not card numbers or customer identities, which keeps payment card data out of scope; any integration with a card terminal should stay with the terminal provider. Testing compares dashboard totals against known transaction sets, checks refunds and split payments, verifies day boundaries and time zones, and reviews readability on real low-resolution terminal displays under store lighting.
Technology
React builds the dashboard from small, self-contained cards and charts that update independently as new sales arrive. A Node.js service aggregates transactions so heavy calculation stays off the client. PostgreSQL stores sales records and handles grouping by day, item and payment type efficiently.
Outcome
RetailPOS gives a retail team a clear, glanceable read of the trading day right where sales happen. Staff and managers can see revenue, best sellers and payment mix without opening a report, which supports quicker decisions on restocking, counter staffing and cash handling. It shows how reporting can be adapted to the physical setting in which it is used.
Frequently asked questions
How much does it cost to build a retail sales dashboard?
It depends on how many data sources feed it, how many stores and terminals it covers, whether figures must update live, and how much historical reporting you want. Integration with your existing till system is usually the largest variable.
What metrics should a retail POS dashboard show?
Start with revenue, transaction count, best-selling items and payment mix, since these support decisions on the shop floor. Margins, staff performance and stock levels can be added once the basics are trusted.
Can a dashboard work on a small POS terminal screen?
Yes, if it is designed for that size from the start: fewer elements, larger type and charts that simplify rather than shrink. Testing on the real device is essential.
Highlights
- High-visibility cards for daily revenue
- Payment-method breakdown chart
- Top-selling items view
- Layout tuned for small POS-terminal screens
- Server-side aggregation keeps the browser light
- React, Node.js and PostgreSQL